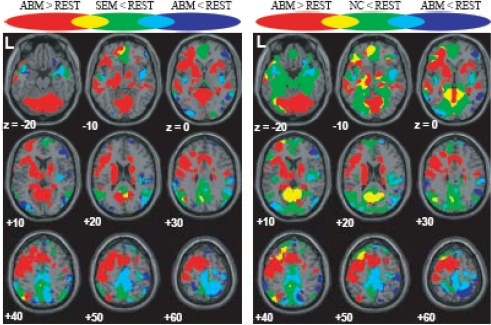
Fig. (3).
Regions which showed greater/less activation during ABM in relation to the DMN, superimposed on the axial images of the MNI T1 template. red = ABM > REST; blue = ABM < REST; green = SEM < REST or NC < REST; yellow = overlap between ABM > REST and SEM < REST or that between ABM > REST and NC < REST; light blue = overlap between ABM < REST and SEM < REST or that between ABM < REST and NC < REST.

