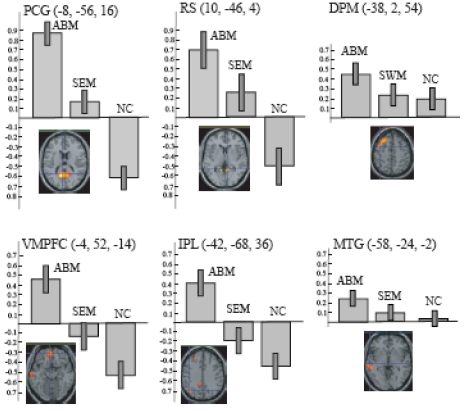
Fig. (5).
The contrast effect of each task condition (ABM, SEM, and NC) compared to REST in the local maxima for the overlap between AMB > REST and ABM > SEM, which correspond to the intersection of lines in the lower panels. Bars represent the limit of the 90% confidence interval around the mean. DPM, dorsal premotor area; IPL, inferior parietal lobule; MTG, middle temporal gyrus; RS, retrosplenial cortex; PCG, posterior cingulate gyrus; and VMPFC, ventro-medial prefrontal cortex.

