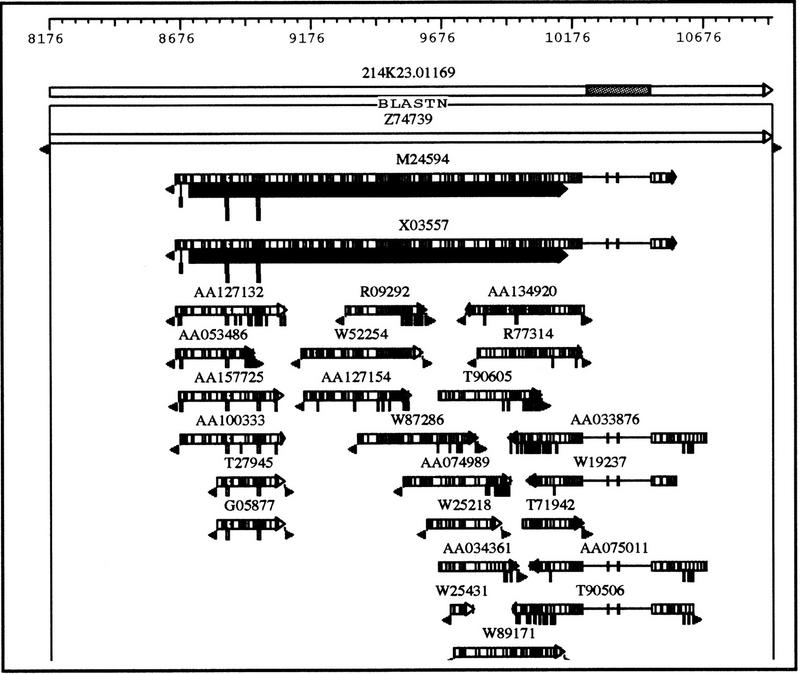
Figure 2.

Detailed graphic view of the third alignment cluster in Fig. 1. The shaded area in the query sequence represents a repeat region. Each rectangle represents an alignment. The arrow at the end indicates the orientation of alignment. The numerous grey lines inside the rectangle represent mismatched residues compared with the query sequence. A gap in a matching sequence is represented by a single line connecting two adjacent rectangles, and an insertion is represented by a vertical bar connected to a rectangle that is proportional to the size of the insertion. The triangles at the end indicate unaligned ends, often seen in EST matches because of the degenerating data quality at the ends of the “single pass” sequence reads. The grey rectangles beneath the two mRNA sequences (GenBank accession nos. M24594 and X03557) show the coding region features in the aligned region.
