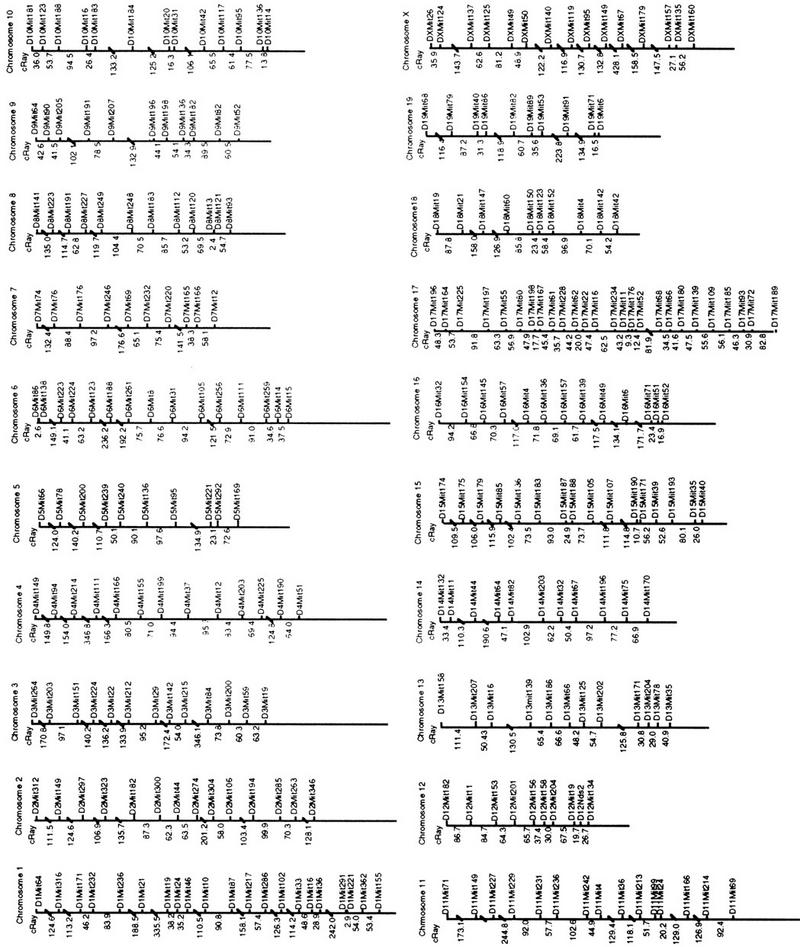
Figure 4.

WG–RH anchor maps of the mouse genome. Most of the chromosomal maps consist of more than one linkage group. These linkage groups are supported by a two-point lod score of >4, and the map within each linkage group was identified as the best order using multipoint analysis. Low statistical support for ordering between these linkage groups prevents their orientation relative to each other. Because these groups could not be oriented relative to one another using only WG–RH data, the existing genetic map was used to position the marker groups separated by gaps in the RH map. Large distances and gaps in the RH map are indicated by diagonal strokes. The marker orders on the WG–RH anchor map are consistent with those on the genetic map.
