
Figure 1.

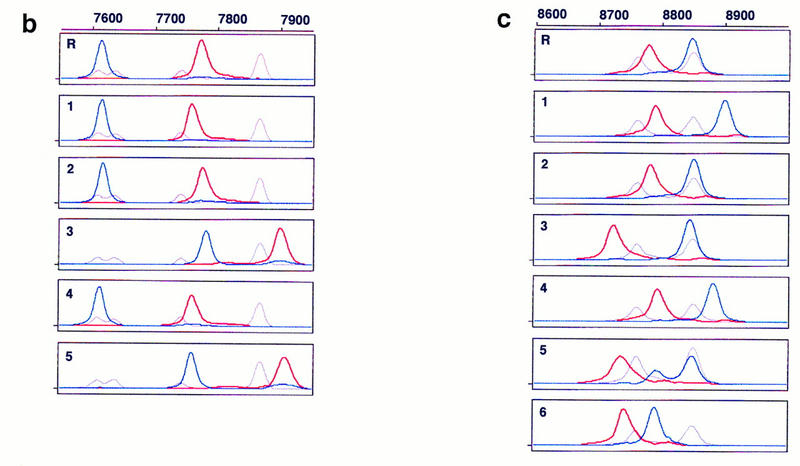
Electropherograms of multicolor fluorescence CE–SSCP. PCR products amplified from B. subtilis gyrA (a), hFIX exon 7 (b), and hFIX exon 8 (c) DNA were postlabeled with R6G–dCTP (red, sense strand) and R110–dUTP (blue, antisense strand) at their 3′ ends, and serially analyzed by CE–SSCP, together with TAMRA-labeled internal controls (gray, both strands). The internal controls were GS 2500 for gyrA, and a mixture of GS 500 and TaqαI fragments of pcDNAI for both hFIX exons 7 and 8, in addition to their respective normal sequences. Run-to-run differences in mobility were calibrated using peaks of TAMRA. Sample numbers correspond to mutant numbers in Table 2. (R) Wild type (gyrA) or normal (hFIX exons 7 and 8). Abscissa scaled at the top is retention time in data point (70-msec interval), and ordinate is fluorescence intensity in arbitrary unit. Data point 1 corresponds to 5 min after start of electrophoresis.