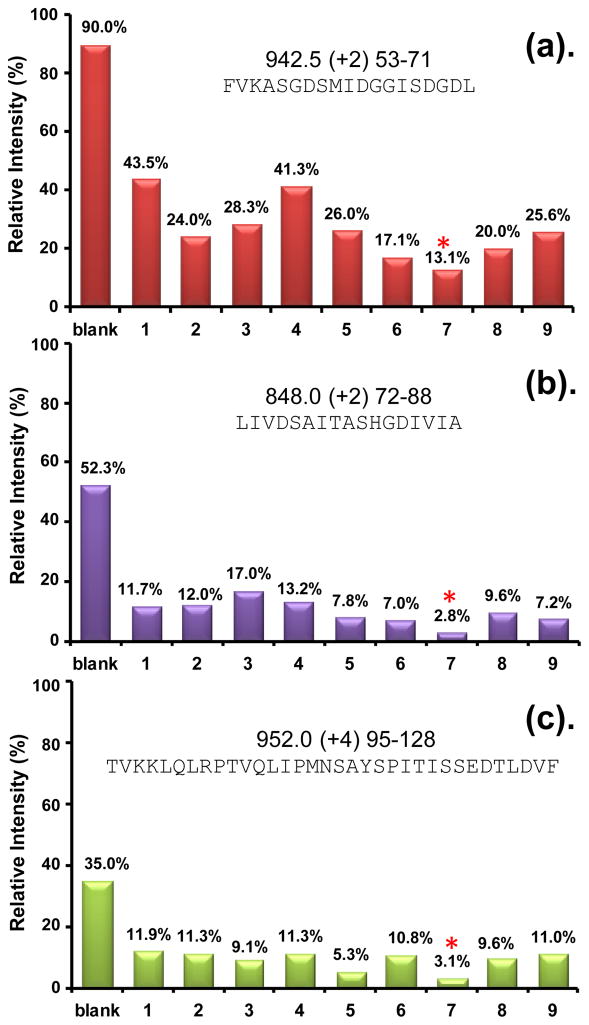
Figure 5.
Effectiveness of different wash protocols in eliminating peptide carryover. Three of the most sticky peptides from UmuD are shown (see Figure S1 for other peptides). The m/z, charge state, and sequence of each peptide ion are shown at the top of each graph. The far left column indicates carryover without washing (e.g., a value of 90% means that the intensity of the peptide ion signal in a blank run following a sample run was 90% of the signal intensity in the sample run). Columns 1–9 show the relative intensity of the peptide ion in a blank run after an intermediate washing step using the washing protocols labeled 1–9, respectively, in Table 1. For example, the intensity of the peptide ion in panel (a) fell to 13.1% in a blank run after wash protocol 7 was used immediately post sample run. The most effective wash protocol overall was number 7, indicated with an *.

