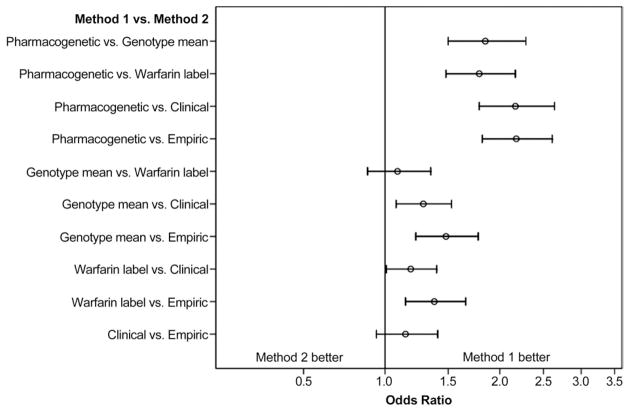
Figure 2. Two-Way Comparisons of Dosing Methods.
The proportion dosed within 20% of stable therapeutic dose was compared using McNemar’s chi-square test. The resultant odds ratio reflects the odds of a patient’s being properly dosed by the first method versus the second. Error bars represent exact 95% confidence intervals.

