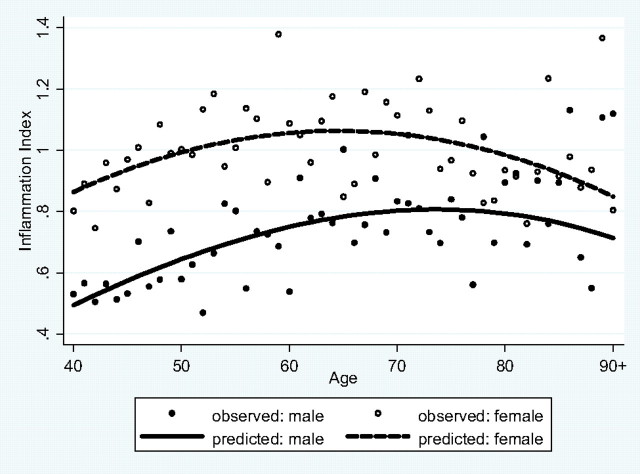
Figure 1.
Sex difference and age variation in inflammation index. Note: Instead of the individual observations that would preoccupy the graph due to their large number, the observed data represent the mean for each age. The same applies to Figures 2 and Supplementary Figures A–C.

