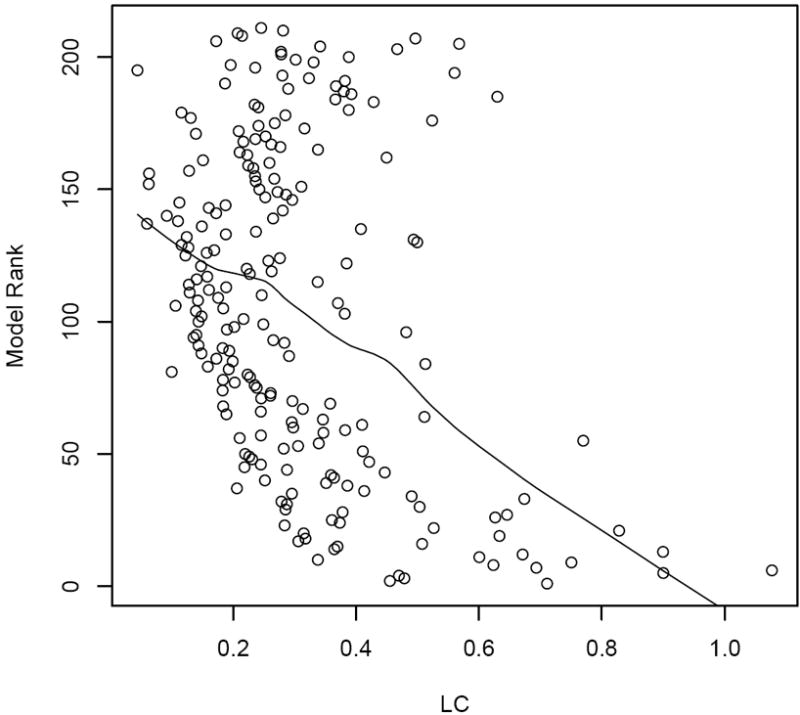
Figure 3.

A simulation example with a single explanatory variable in the model. The x-axis is the expectation of the absolute difference between the spatial residuals of the adjacent counties by LC method. The y-axis marks the ranks produced by BIC for the 211 models using SAR spatial effects. A loess smoothed line is also shown on the plot.
