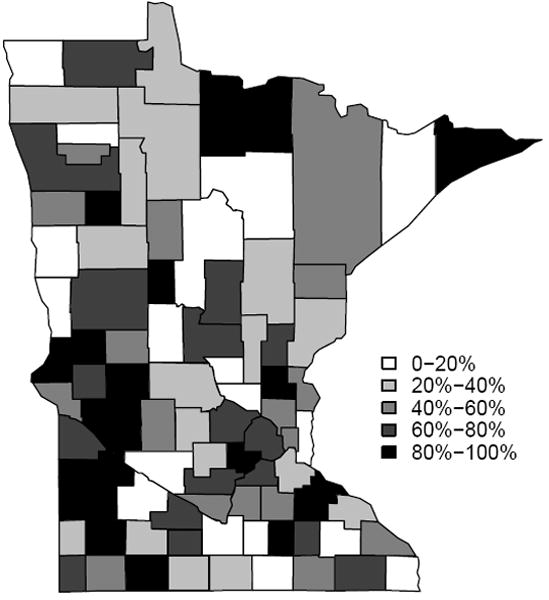
Figure 6.

Choropleth map of residuals from the SAR model. The map from the CAR model is very similar. Darker colors represents higher value of the spatial residuals after adjusting for the covariate, which also implies the county is more affected by P&I.
