Fig. 2.
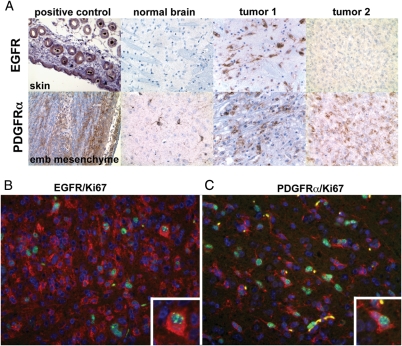
Detection of EGFR and PDGFRα in primary murine astrocytomas. Top panel (A) shows DAB staining for EGFR (top row) and PDGFRα (bottom row). The first column shows positive control tissue for each antibody (EGFR = skin; PDGFRα = embryonic mesenchyme). The second column shows staining of normal brain with each antibody. The third column shows an example of a tumor that was positive for both EGFR (top) and PDGFRα (bottom). The fourth column shows an example of a tumor that was negative for EGFR (top) and positive for PDGFRα (bottom). EGFR (red) (B) or PDGFRα (red) (C) co-expresses with the proliferation marker Ki67 (green) in murine astrocytomas. Two NPcis littermates developed brain tumors and were euthanized on the same day. One tumor showed high expression of EGFR (B), whereas the other showed high expression of PDGFRα (C). Atypical cells and proliferating (Ki67+) cells (inset) stain for the receptors, demonstrating that tumor cells rather than only normal surrounding stroma cells are overexpressing the receptors.

