
Figure 2.
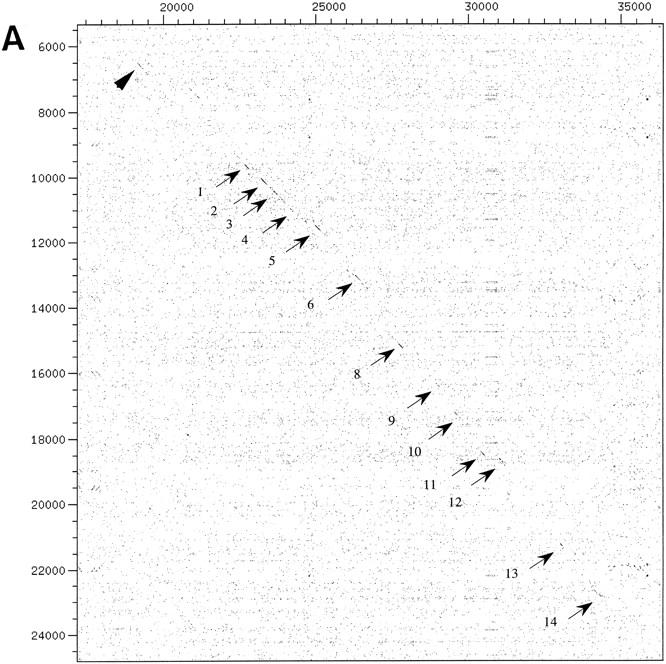

(A) Dot-matrix comparative analysis of hAIRE and mouse Aire genomic sequences: HSAJ9610 is represented on the x-axis and AF073797 on the y-axis. Arrows denote exons; the arrowhead points to a conserved region located ∼3 kb upstream of the gene. (B) Alignment of the conserved nucleotide sequence identified in A. Numbers at the end of lines indicate nucleotide positions. Consensus sequence is drawn below the alignment. Box corresponds to the core conserved sequence.