Fig. 1.
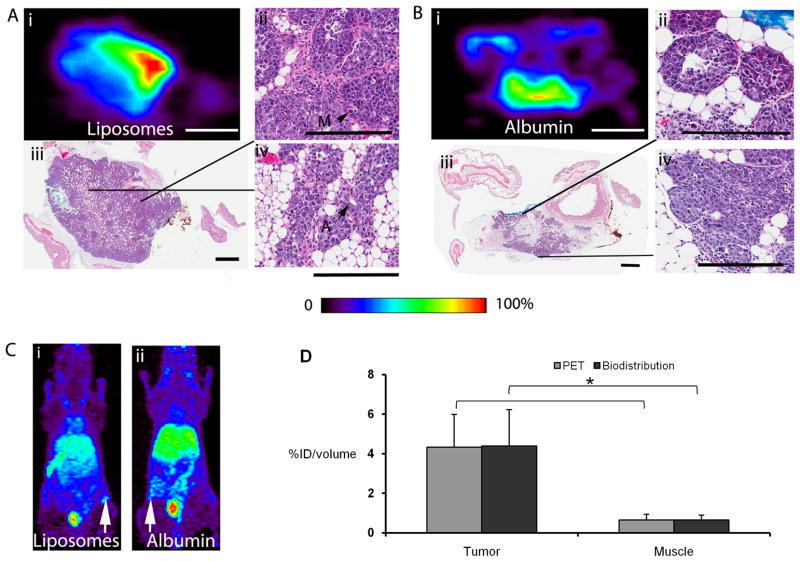
PET and histological images at the time of transition. Ai) Ex vivo PET image acquired 48 hours after injection of Cu-labeled liposomes at week 5 (scalebar 5 mm). Aii) H&E showing increased mitotic cells (M), indicating an area of transformation to carcinoma. This area corresponds geometrically with the region in Ai) with high tracer uptake (20 ×, scalebar 200 μm). Aiii) Low-power H&E of the MIN-O precancer filling the precleared fat pad with early carcinoma of the same tumor (scalebar 1.5 mm) as in Ai). Regions with increased liposome uptake in Ai) correspond geometrically with regions in the H&E section with high cellular density and less residual fat. Aiv) High-power H&E of acinar and ductal structures with high intra-lesional heterogeneity (20 ×, scalebar 200 μm, A-acini). Bi) Ex vivo PET image at 48 hours after injection of Cu-labeled albumin is homogenous with lower uptake than observed with liposomes in Ai) (identical image settings) (scalebar 5 mm). Bii) Precancerous region with well differentiated cells and ducts (20 ×, scalebar 200 μm). Biii) Low-power H&E of the same lesion as in Bi) with the MIN-O precancer filling the precleared fat pad (scalebar 1.5 mm). Biv) The edge of the precancerous region at higher power (20×, scalebar 200 μm). Ci and ii) Maximum-intensity-projection (MIP) images at 48 hours of the same mice as in Ai) and Bi) respectively. D) PET measurements in tumor and striated muscle correspond well with biodistribution data. White arrows indicate tumors. PET image color scale from 0–100%.

