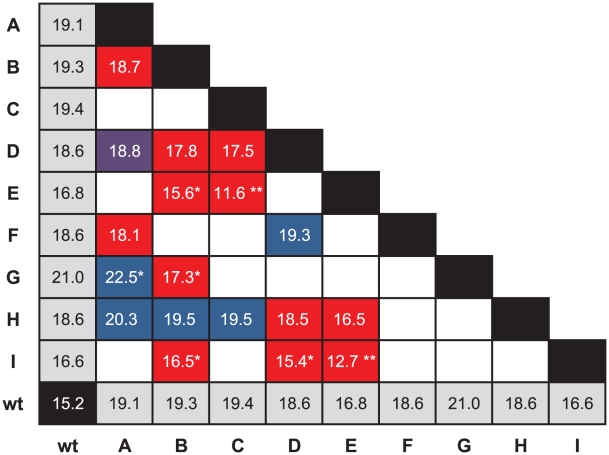
Figure 2. Evidence for decompensatory epistasis.
The grid shows the fitnesses of the wild type, single mutants, and double mutants. Empty cells represent the double mutants that were not constructed. Red indicates that the average fitness of the double mutant is lower than the average fitness conferred by its two constituent single mutations. Blue indicates that its fitness is higher than that of either single mutant, and purple indicates that it is between the fitnesses of the two single mutants. A “*” in a red box indicates the double mutation confers a fitness significantly lower than that conferred by one single mutation, and a “**” indicates that the double mutation confers a fitness significantly lower than that conferred by either of its single mutations. A “*” in a blue box indicates that the double mutation confers a fitness significantly higher than that conferred by either constituent single mutation.

