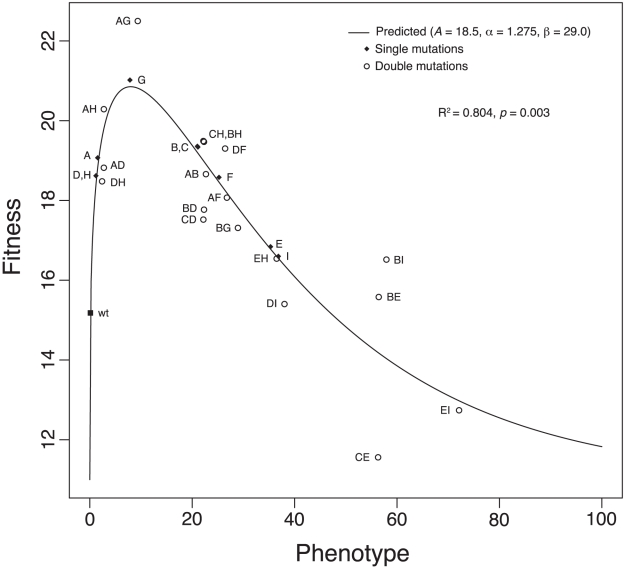
Figure 3. The phenotype-to-fitness map.
The plot shows the fit of our model for the phenotype-to-fitness map. The model assumes a gamma curve for the relationship between fitness and phenotype. Phenotypic effects were assumed to be additive and epistasis for fitness to arise through the shape of the curve. The variance of the normal error was estimated to be  .
.  gives the coefficient of determination. The
  value is based on an
  test comparing our model to a model assuming that single- and double-mutant fitnesses are independent of each other. For these data,
  . We rescaled fitness by substracting
  rather than the fitness of the wild type to avoid negative values.

