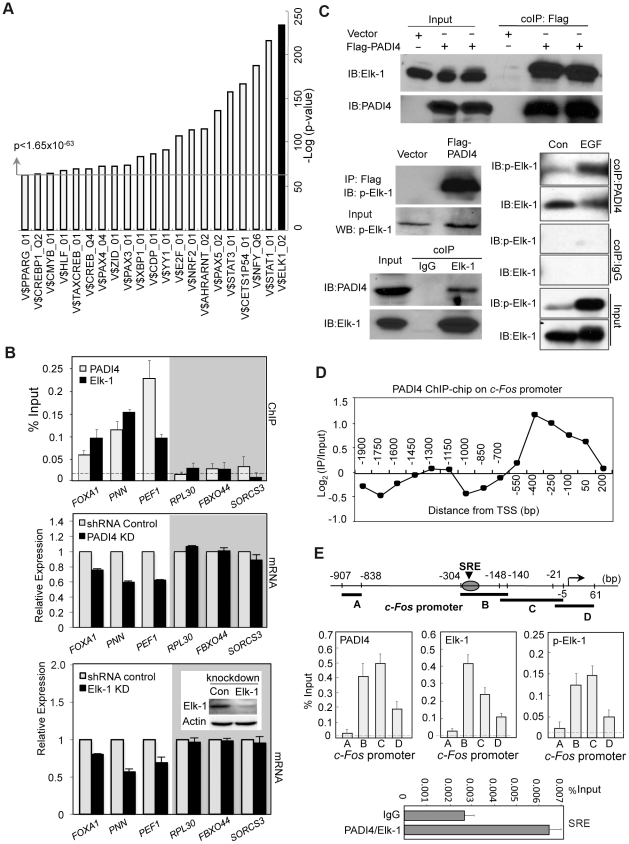
Figure 3. Co-occupancy by PADI4 and Elk-1 on a subset of Elk-1 target gene promoters.
(A) Identification of enriched TFBS within the promoter regions of the significant PADI4 bound genes (p<0.016). The bar chart displays the negative log of the enrichment P values using Fisher exact test for the top 21 motifs. The most significant V$ELK1_02 is shown on the right in black. (B) Gene-specific analysis of promoter binding by PADI4 and Elk-1 using ChIP-qPCR in MCF-7 cells (upper panel) and mRNA expression by RT-qPCR in shRNA control and PADI4 knockdown (middle panel) or Elk-1 knockdown MCF-7 cells (lower panel). The insert in the lower panel shows the shRNA-mediated depletion of Elk-1 in MCF-7 cells versus shRNA control cells by western blot. For each gene, the independent PADI4 and Elk-1 ChIP experiments were performed with the same promoter primers. The non-specific binding in the ChIP assay is indicated by the horizontal dotted line. Expression data are normalized to GAPDH transcripts and the graph is mean + SEM. The control genes without potential binding sites for both PADI4 and Elk-1 on the promoter are shown in the gray shadow. (C) Co-IP assays in 293 cells reveal that PADI4 interacts with both Elk-1 and phospho-Elk-1. Lysates of HEK293 cells transfected with a plasmid carrying Flag-PADI4 were immunoprecipitated with anti-Flag M2 affinity gel followed by western blot analysis using antibodies against Elk-1, phospho-Elk-1 and PADI4 (upper and middle left). Endogenous Elk-1 proteins were immunoprecipitated with anti-Elk-1 antibody, and co-precipitated PADI4 proteins were subsequently detected with anti-PADI4 antibody (bottom left). Immunoblot on the bottom right shows increased levels of p-Elk-1 binding to PADI4 following stimulation with EGF. HEK293 cells were transiently transfected with PADI4, serum starved, and stimulated with EGF. Immunoprecipitations of cell lysates was then performed using the anti-PADI4 antibody and immunoblots were then probed with both anti-p-Elk-1 and anti-Elk-1. Normal IgG antibody was used as a control. (D) PADI4 ChIP-chip signal localizes to the proximal c-Fos promoter. (E) ChIP-qPCR showing that PADI4 and activated Elk-1 specifically bind at the c-Fos SRE promoter region in MCF-7 cells. The schematic at the top of the figure indicates the locations of the primer sets used for ChIP assays relative to the TSS. The SRE region is marked. The non-specific binding in the ChIP assay is indicated by the horizontal dotted line. Data are represented as mean + SEM (n = 3). ChIP-re-ChIP experiments (bottom) detected simultaneous binding of PADI4 and Elk-1 to the c-Fos SRE region in MCF-7 cells. The first step ChIP was performed using anti-PAD4 antibody and the second step ChIP was performed using anti-Elk-1 antibody. IgG was used as an irrelevant control.

