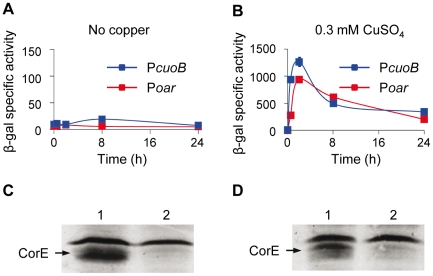
Figure 4. Searching for the CorE anti-σ factor.
(A and B) Quantification of β-gal activity (cuoB expression) in strains where corE was cloned under the control of the oar promoter (red lines) or its own promoter (blue lines). Activities were determined in the absence of metal (A) or in the presence of 0.3 mM copper (B). Note the difference in the scales of the two panels. Error bars indicate standard deviations. (C and D) Western blot analyses to confirm the over-production of CorE in the absence (C) or in the presence (D) of 0.3 mM copper in the strains harboring the gene corE cloned under the oar promoter (lane 1) or its own promoter (lane 2). Proteins were collected at 2 h after copper addition. The band of equal intensity in all the lanes corresponds to an unidentified M. xanthus protein that reacts with the anti-His tag antibody used in the assay. The intensity of this band, which does not change in the conditions tested, has been used to standardize the amount of protein loaded in each lane.

