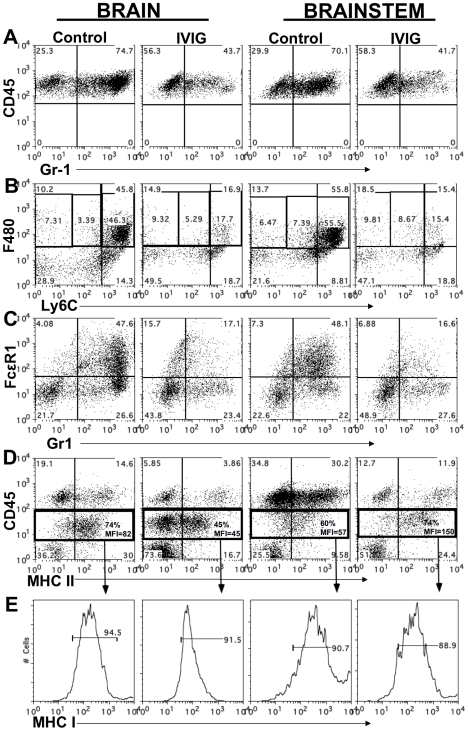
Figure 3. IVIG alters the phenotype of macrophages and microglia.
CD45high infiltrates in brain and BS of control or IVIG treated 129 mice at d8 pi analyzed for (A) Gr-1+ cells; (B) Ly6Chigh and (C) FcεR1+ F480+ macrophages. (D) MHC II expression on CD45high macrophages and CD45int microglia isolated from BS or brains; frequencies and mean fluorescence intensity (MFI) of MHC II+ CD45 microglia (boxed regions) shown. (E) MHC I expression by CD45int microglia. Data representative of 2–3 experiments (n = 6–12 mice).

