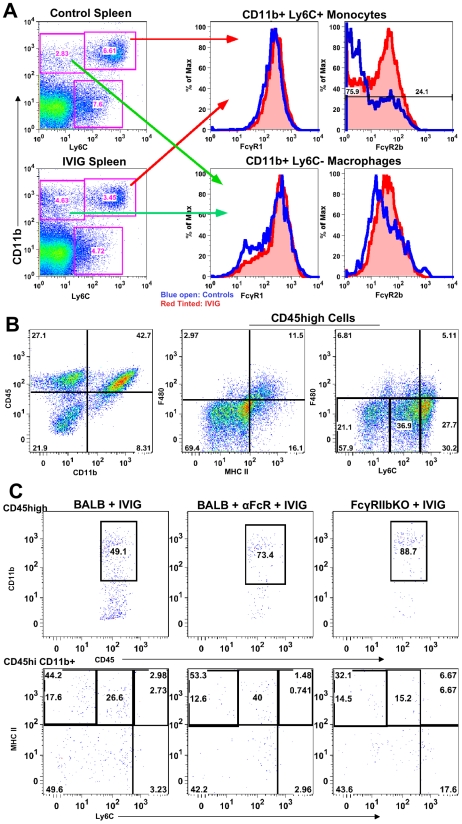
Figure 5. FcγRIIb limits CNS infiltration.
(A) Ly6C+ (top right 2 plots) and Ly6C− (bottom right 2 plots) subsets of CD11b+ splenic macrophages in control PBS (top left) and IVIG treated (bottom left) 129 mice at d 6 pi analyzed for FcγRI (middle plot) or FcγRIIb/III (right plot) expression. (blue lines: PBS treated macrophages; red lines: IVIG treated macrophages). (B) CD45high CD11b+ monocytes in BS of anti-FcγRIIb/III mAb depleted IVIG treated 129 mice at d8 pi (left). F480+ macrophages analyzed for MHC II+ (middle) and Ly6C expression (right); plots gated for CD45high infiltrates. (C) Infected BALB/c mice given IVIG following treatment with either isotype (left) or anti-FcγRIIb/III mAb (middle) and analyzed for CD45high monocytes at d6 pi (top row); cells gated on CD45high infiltrates. Infected FcγRIIb KO mice given IVIG and analyzed for infiltrating monocytes (right). CD45high CD11b+ gated monocytes from these groups analyzed for Ly6C and MHC II+ expression (bottom row). Data representative of 2 experiments (n = 6–8 mice).

