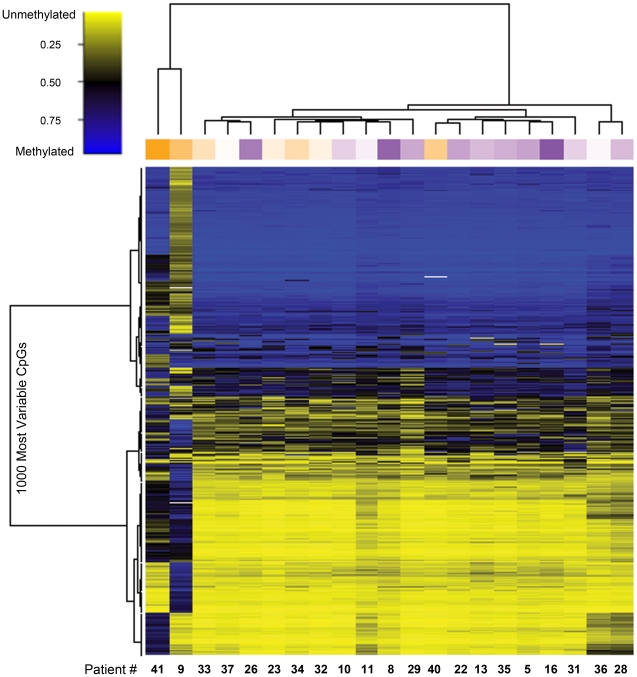
Figure 1. Unsupervised clustering of the 1,000 most variable CpG loci average beta values.
The dendrograms above the heatmap show unsupervised clustering based on the methylation data alone, using a Euclidean metric with Ward's method of hierarchical clustering. Patients are represented by column (n = 21) and CpG loci (n = 1000) by row. Each cell represents the CpG level of methylation for one site in one sample. The methylation scale indicates the level of methylation: yellow = sample predominantly unmethylated (0–49% methylated); black = 50% of the sample is methylated; blue = sample predominantly methylated (51–100%). The column annotation track shows motility: orange = low, purple = high.

