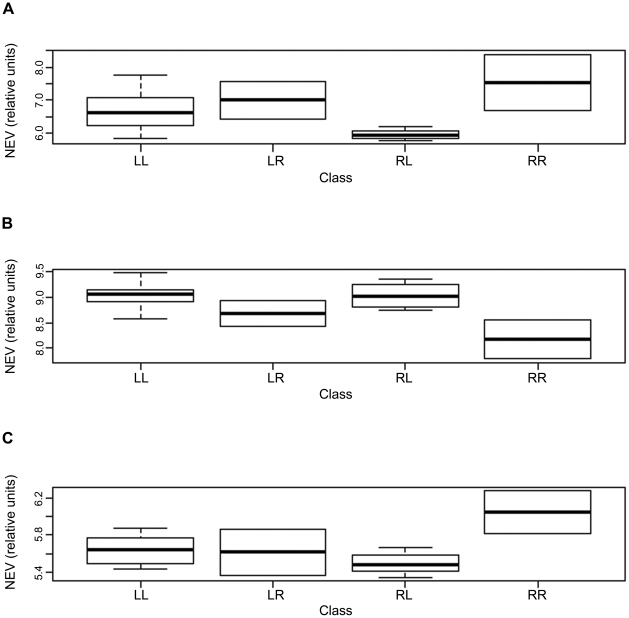
Figure 4. Boxplots comparing DNA methylation profiles and gene expression values for the 3 epigenetic regulators.
Each panel of boxplots (A–C) compares expression data for a particular gene: (A) HDAC1; (B) SIRT3; and (C) DNMT3A. The x-axis represents RPMM classes. The y-axis represents normalized gene expression values (NEV).

