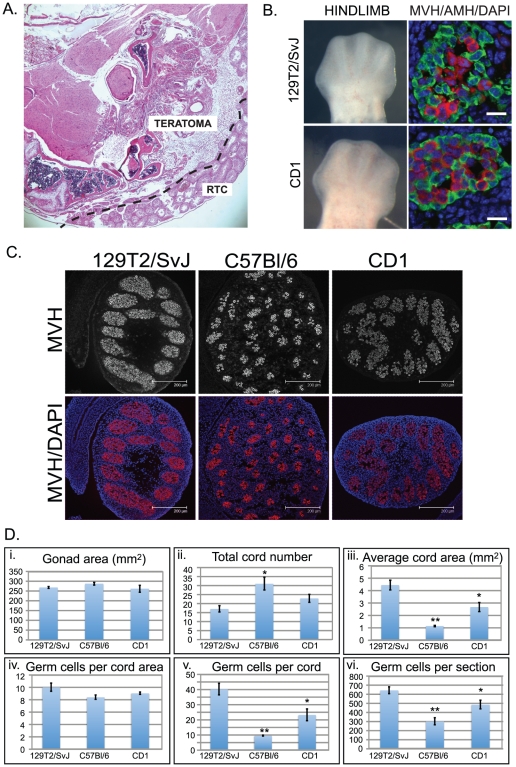
Figure 1. Developmental characteristics of 129T2/SvJ mouse gonads.
A. H&E stained cross section of a teratoma collected from an adult 129T2/SvJ mouse testis. RTC: residual testis cords. B. Bright field images showing hindlimb morphology of typical E12.5 129T2/SvJ and CD1 embryos (Left images). Immunofluorescent staining of E12.5 fetal testis sections from 129T2/SvJ and CD1 mice. AMH is shown in green, while MVH is shown in red. DAPI (blue) marks the cell nuclei. Scale bars; 10 um. C. Immunofluorescence showing the typical extent of the germ cell populations marked by MVH staining (red) enclosed by testis cords in E15.5 129T2/SvJ, C57Bl/6 and CD1 fetal testes (a further four independent individuals are shown in Figure S1). DAPI (blue) marks the cell nuclei. Scale bars; 200 um. D. Quantification of the gonad area, total cord number, average cord area, number of germ cells per cord area, the number of germ cells per cord and the number of germ cells per section for whole testis sections taken from E15.5 129T2/SvJ, C57Bl/6 and CD1 embryos (Data represents +/−SEM, eight-ten sections for at least 4 testes). Statistical differences compared to 129T2/SvJ were calculated: * indicates p<0.05, ** indicates p<0.01.

