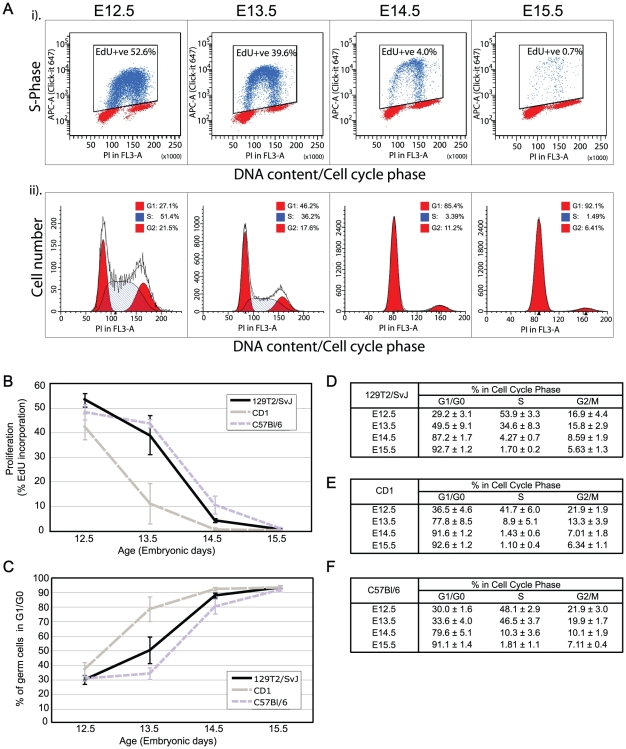
Figure 2. Fluorescence activated flow cytometric analysis of S-phase progression and cell cycle state in teratoma susceptible and non-susceptible fetal mouse germ cells.
(A) (i) Typical example of E12.5-E15.5 129T2/SvJ germ cells analysed for EdU incorporation after 2 hours of in-vivo exposure to EdU. MVH positive cells were isolated against an MVH stained limb control (MVH negative) sample ([14], not shown) while the EdU gate was set against an EdU negative control. (ii) ModFit cell cycle analysis based on DNA content assessed by propidium iodide staining in the same germ cell populations as shown in (i). (B) Germ cell proliferation based on EdU incorporation in E12.5-E15.5 129T2/SvJ, C57Bl/6 and CD1 fetal gonads. Data is represented by 3-6 biological replicates for each time point and strain analysed. Error bars represent standard deviation. (C–F) ModFit analysis of germ cell cycle state, based on propidium iodide staining for DNA content in E12.5-E15.5 129T2/SvJ, C57Bl/6 and CD1 fetal gonads. C: percentage cells in G0/G1 for the 129T2/SvJ, C57Bl/6 and CD1 strains, D–F: percentage of cells in each cell cycle stage for 129T2/SvJ, CD1 and C57Bl/6. Data is represented by 3–6 biological replicates +/− standard deviation for each time point and strain analysed.

