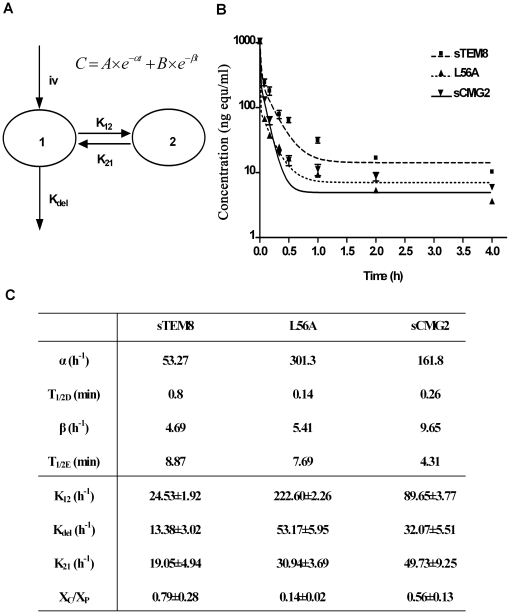
Figure 4. Pharmacokinetics of the variants.
A. Schematic diagram of the two-compartment model, which is generally used for protein drugs administered i.v. by pulse injection. The two compartments are divided based on the different pharmacokinetic rates with the central compartment (denoted as compartment 1) representing the vascular cavity and the peri-compartment (denoted as compartment 2) representing relatively compact tissues. The elimination was limited in compartment 1 for simplification. The model can then be symbolized as  . B. Plasma concentration-time plots of receptor decoys after i.v. injection into rats (n = 6) at a dose of 67.5 µg/kg. The point at time 0 was plotted based on a deduced initial concentration of 105 ng/ml, which equaled the injection amount (13.5 µg for 200 g on average) divided by the theoretical circulating blood volumes (12.8 ml for 200 g on average) [32]. Analysis applied the two-compartment model. Profiles are fitted by a two-phase exponential decay equation (GraphPad Prism software, San Diego California USA) with constraints of α>1, β>1, and values shared. C. Related pharmacokinetic parameters. Values for α, β were calculated by fitting plots in Fig. 4B with a two-phase exponential decay equation
  (GraphPad Prism software, San Diego California USA), with constraints of α>1, β>1, and values shared. Values for half time were calculated as 0.69/α and 0.69/β. The first degradation rate constants were calculated by
  ,
,  and
and  . K
21, and K
12 represents the crossing rate between compartments, and K
del represents the excretion rate out of the system, as symbolized in figure 4A. XC/XP represents the ratio of drug amount distributed in the central compartment to that of the peri-compartment at equilibrium, which equaled K21/K12.

