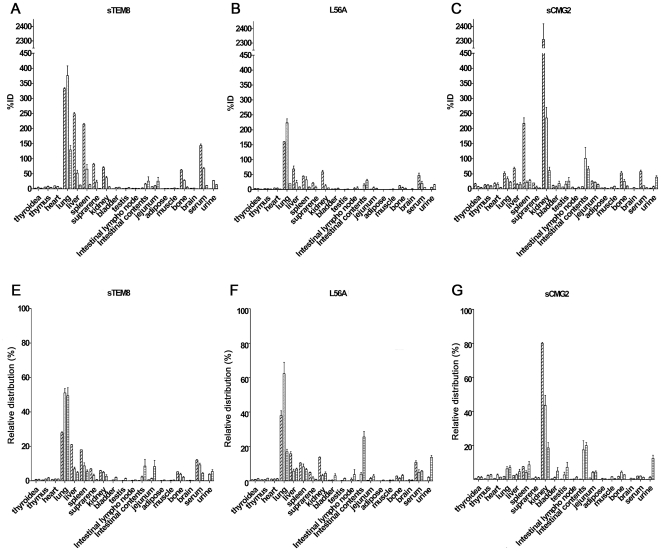
Figure 5. Tissue distribution of the variants.
TCA-precipitable radioactivity (mean ±SEM) in various tissues determined at 5 min, 30 min, and 4 h (n = 6) after i.v. administration to rats. A, B, and C. %ID represents the equivalent drug concentrations calculated according to the radioactivity measured as a percentage of the deduced injection dose (67.5 ug/kg). D, E, and F. Relative distribution represents the drug concentration in a certain tissue as a percentage of the total drug concentration in all the tissues.

