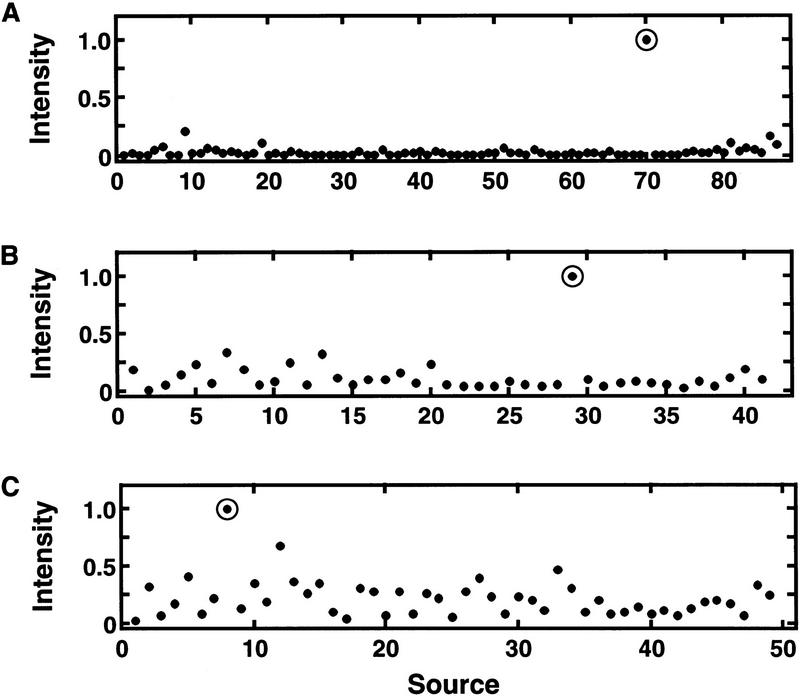
Figure 10.
Stereotypical examples of selective expression in real abundance data as detected by the algorithm. Intensities (abundance) vs. source (library) for three assemblies from a real database of sources and assembly abundances are plotted. (A) An extremely strong overall confidence of selective expression (decision function d = 1.0); (B) strong overall confidence of selective expression (d = 0.75); (C) weak overall confidence of selective expression (d = 0.31). Calculations from the algorithm are summarized in Table 5.

