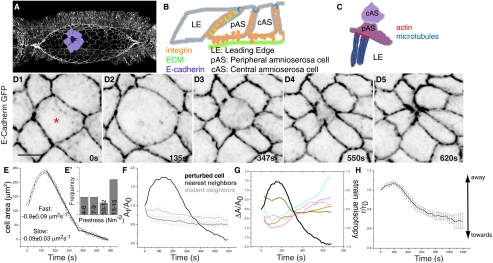
Fig. 1.
Cellular dynamics associated with subcellular cytoplasmic laser perturbation. (A) Stage 14 embryo showing the contour of the AS highlighting a cohort of cells with the delaminating cell (DC, purple) surrounded by its nearest neighbours (lilac). Schematic representation of the adhesive interfaces that enable cellular interactions in the AS (B) and cytoskeletal organization at the LE–pAS cell interface (C). (D1–D5) Time-lapse confocal images of an embryo labeled with E-Cadherin GFP. (E) Representative graph of apical surface area dynamics showing typical velocities (mean ± SEM) of constriction (n = 5). (E′) Frequency distribution of prestress. (F) Fractional change in apical surface area of DC (black), its NN (dark gray, n = 5), and DN (light gray, n = 4). (G) Strain anisotropy of NN (colored) and apical surface area of the DC (black). (H) Centroid position of the NN with respect to the DC (n = 9). Asterisks indicate perturbed cell. Analysis of fractional change in area and perimeter, strain anisotropy, and circularity changes of multiple cohorts can be found in Fig. S1. (Scale bar, 10 μm.)

