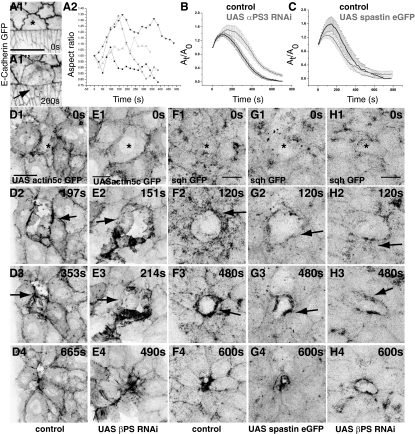
Fig. 3.
Adhesion-dependent mechanical compliance and cytoskeletal polarization. Time-lapse confocal images of an embryo labeled with E-Cadherin GFP showing anisotropic expansion (A1, arrow; n = 5) and aspect ratio dynamics of pAS cells upon perturbation (A2). Dynamics of fractional change in apical surface area induced by perturbation in control cells (black in B and C) and upon expression (gray) of αPS3 RNAi (B; n = 8) or spastin (C; n = 8). Time-lapse confocal images showing response of actin (D and E) and myosin (F–H) to cytoplasmic perturbation in control (D and F), βPS RNAi (E and H), and spastin-overexpressing embryos (G). Asterisks mark perturbed cell. Response of actin to perturbation in αPS3 RNAi can be found in Fig. S6. (Scale bars, 10 μm.)

