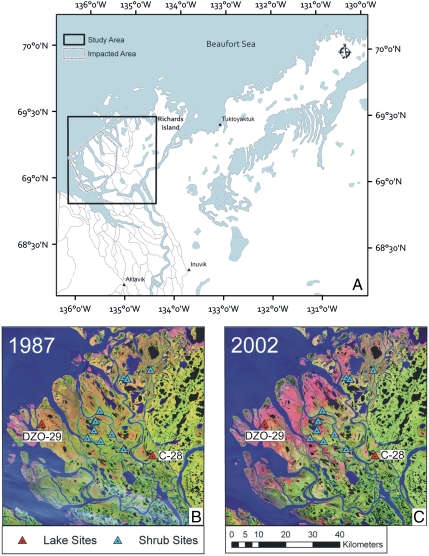
Fig. 1.
Study area and sites. (A): Study area in the Mackenzie Delta region (solid square). An impacted area defined using changes evident on satellite imagery and field reconnaissance is shown by the dashed line. (B): LANDSAT image (August 2, 1987) of the study area showing the location of alder shrub sampling sites, and lakes C-28 and DZO-29. (C): LANDSAT image (July 18, 2002) showing the large change in reflectance in the impacted zone several years after the 1999 storm surge. Standard Top of Atmosphere corrections were applied to both images, which are displayed using Bands 7, 4, and 2. Apparent differences between the two LANDSAT images are due to changes in water level, and do not reflect increased channel width or redeposition of features following the 1999 storm surge event. The exposed surfaces, such as those near the coast or within some of the channels are sandbars with elevations generally < 20 cm. Water levels in the Mackenzie Delta progressively decline during the open-water season, reaching lowest flows in August and September. Thus, differences in the two images reflect these gradual changes in water level during the summer season and the variability between flows in 1987 vs. 2002. Gauge data from Reindeer Station (within ∼2 km of DZO-29) recorded water levels of 9.4 m on August 2, 1987, and 9.6 m on July 18, 2002. Therefore, features that are apparent in the 1987 image were submerged in 2002 and do not suggest that the proximity of Lakes DZO-29 and C-28 changed with respect to the major river channels. Decreased proximity to the channel could have increased their susceptibility to recent storm surges, but our analyses of the LANDSAT images show no significant differences in channel width between the two images.

