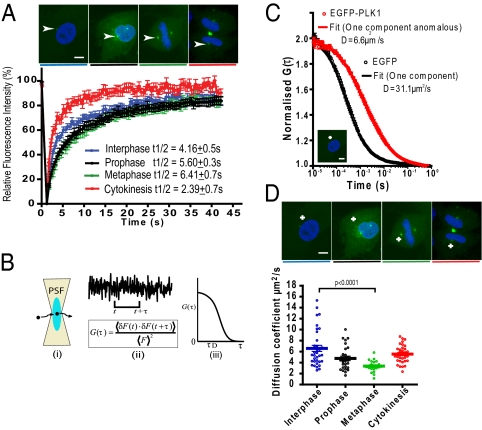
Fig. 1.
Cell cycle-dependent changes in EGFP-PLK1 mobility in the centrosome and cytoplasm. (A) FRAP analysis in EGFP-PLK1 PLK1−/− cells. EGFP-PLK1 in the centrosome was bleached for 1.2 s and recovery monitored at 0.5-s intervals. t1/2 values represent the time taken for 50% maximal recovery, visible as the gradient of the graph. Images show cell-cycle stages in representative fixed cells; white arrowheads denote centrosomes. (Scale bars, 5 μm.) Data show the mean ± SEM (n = 20 cells) from two independent experiments. (B) Diagram of FCS methodology, showing how temporal analysis of fluorescence fluctuations (i) is converted into the autocorrelation function (ACF) (ii), which is related to diffusion time (iii). (C) FCS measurements of EGFP-PLK1 (red) are right shifted compared with free EGFP (black). Readings were taken in the cytoplasm of interphase EGFP-PLK1 PLK1−/− cells (crosshair in image) or RPE cells expressing EGFP. FCS curves (circles) are overlaid with the fits (solid lines) from which diffusion coefficients were determined. Values show the mean ± SEM from ≥20 measurements taken in 20 different cells. Data are representative of three independent experiments. (D) Cell cycle-dependent EGFP-PLK1 mobility in the cytoplasm. EGFP-PLK1 diffusion coefficient values were calculated from FCS measurements derived as described in B and C. Each point of the dot plot represents the measurement from a single cell, produced from 10 × 5-s readings. The crosshairs in the images mark where the confocal volume was positioned for FCS analysis. Data are representative of three independent experiments.

