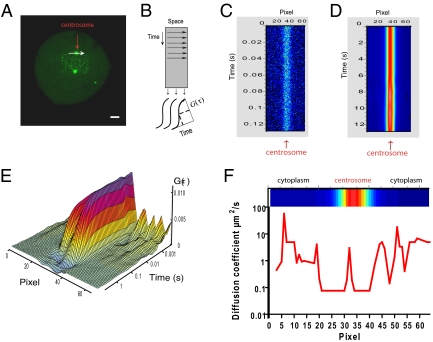
Fig. 4.
Line scanning reveals a region of restricted EGFP-PLK1 mobility at the centrosome. (A) Line-scanning data collection line (white arrow) passing across the centrosome (red arrow), in an EGFP-PLK1(wt) cell undergoing metaphase of mitosis. (B) Schematic of line-scanning data collection and analysis, showing how a time series along a single line is represented as an intensity carpet whereby the x axis represents the pixel position in space along the line and the y axis represents time. The FCS ACF, G(τ) (Eq. S2 in SI Methods), is calculated down each x-axis column and fitted to a model to obtain a diffusion coefficient for that pixel. (C) Line-scanning intensity carpet diagram of EGFP-PLK1 collected along the line denoted by the white arrow in A. A total of 100,000 lines were collected with a pixel dwell time of 5 μs. The diagram is pseudocolored relative to fluorescence intensity; note the accumulation of EGFP-PLK1 in the centrosome. (D) A larger time segment of the carpet diagram collected in C, displayed by averaging the y axis to show ∼12 s of time in total, and corrected for whole organelle movements. (E) The ACF, G(τ), calculated down each column of the line scan, colored according to the amplitude of G(τ). Note the longer decay along the time axis in columns corresponding in position to the centrosome. (F) EGFP-PLK1 diffusion is corralled at the centrosome. The line graph shows diffusion coefficient value versus pixel position. Diffusion coefficients were calculated by fitting the ACFs in E with a one-component anomalous diffusion model (Eq. S3 in SI Methods). A section of the intensity carpet diagram indicating the position of the centrosome is at the top of the graph. Shown are measurements from a single cell representative of two independent experiments on 30 cells in total.

