Fig. 4.
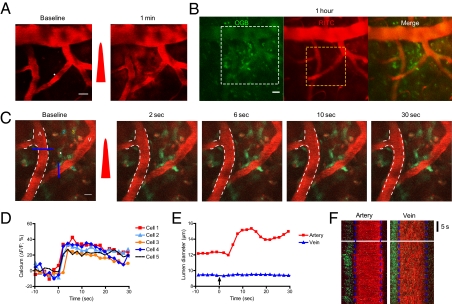
Interrogation of astrocyte-mediated vasodilation in the brain. (A) Oregon Green Bapta-1:00 AM and rhodamine-dextran were injected i.v., and extravasation was induced via femtosecond laser irradiation. The white dot indicates the region of laser irradiation; the red pulse indicates laser irradiation. (Scale bar: 20 μm.) (B) Images were obtained at 1 h after extravasation. The white dotted box indicates the region of interest in A, and the yellow dotted box denotes the region of interest in C. (Scale bar: 20 μm.) (C) Time-series images of vasodilation by photoactivation of astrocytes. The white dot indicates the region of laser stimulation; the red pulse indicates laser irradiation. Note the calcium waves in the targeted and surrounding cells and subsequent vasodilation. The white dotted line demarcates the baseline lumen of the arteriole. The colored numbers indicate the cells used for calcium signal analysis in D. A, artery. V, vein. (Scale bar: 10 μm.) (D) Quantification of calcium signals in the cells and astrocyte endfeet around the artery. (E and F) Temporal kinetics of lumen diameter change in the artery and vein in C. The blue lines in C indicate the region used in F.

