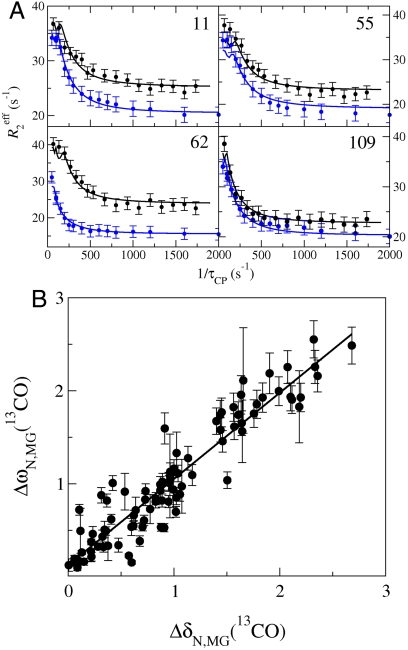
Fig. 3.
Probing backbone conformational changes using 13CO R2 dispersion. (A) Representative 13CO (black) and 15N (blue) R2 dispersion curves collected on a single sample of 13C, 15N-apoMb, pH 4.75, at a static magnetic field of 18.8 T. Data acquired at a static field strength of 14.1 T were included in the global fit but are omitted from the figure for clarity. The solid curves represent three-state global fits to the exchange model N⇆I1⇆MG. (B) Correlation between ΔωN,MG (ppm) obtained from a global three-state fit to 13CO and 15N R2 dispersion data at pH 4.75, and |ΔδN,MG| determined from 3D NMR data under equilibrium conditions (pH 4.75 and 4.1 for N and MG, respectively). The line shows a linear fit to the data (R2 = 0.88, slope 0.93). A description of parameter constraints and uncertainty analysis is in the SI Text.

