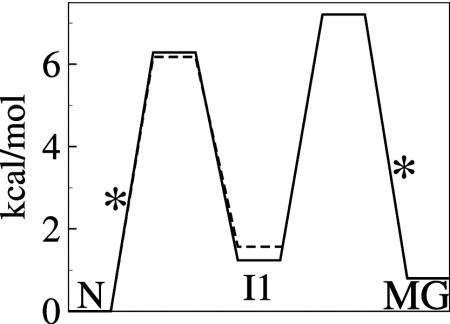
Fig. 4.
Schematic free energy diagram for three-state transient unfolding (N⇆I1⇆MG) of apoMb at pH 4.95 (solid) and two-state unfolding (N⇆I1) at pH 5.5 (dashed). Barrier heights were calculated from the rates in Table 1 and Table S1 using transition-state theory and a standard assumption for the prefactor for protein folding (35). The rate-limiting barriers are marked with asterisks. The free energies of the I1 and MG states are 1.2 and 0.9 kcal/mol, respectively, above the N state.

