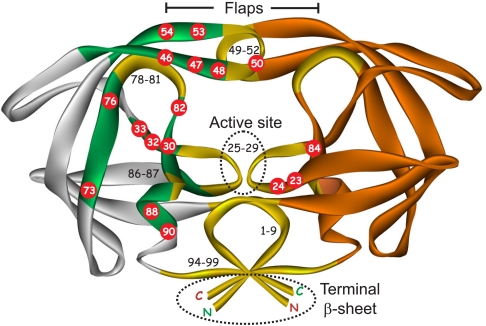
Fig. 2.
Ribbon representation of mature PRM structure showing the location of highly conserved regions under drug pressure (gold and black lettering) (25), regions of natural variability in PR among the four groups M, N, O, and P (gray), and naturally conserved regions where major DRMs are selected under drug pressure (green). Numbered red circles indicate the positions of major DRMs, as defined in the Stanford database and the red lettering in Fig. S1C. Dimer interfaces are shown in dotted ovals.

