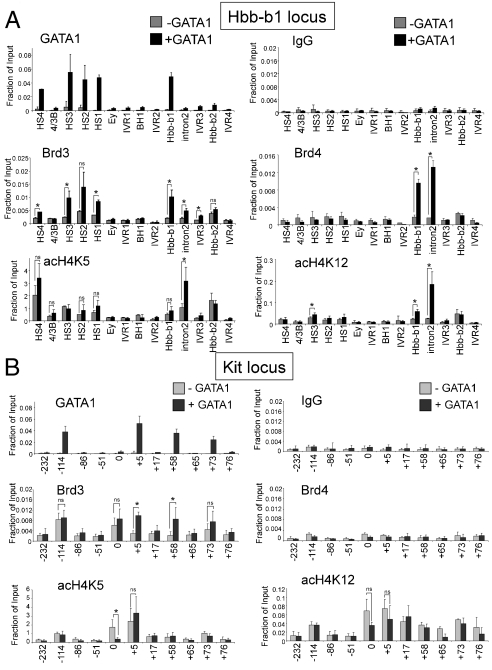
Fig. 3.
Cooccupancy of Brd3 and GATA1 at active and repressed target genes. (A) ChIP-qPCR with indicated antibodies or control (IgG) in G1E (−GATA1) and estradiol-treated G1E-ER4 (+GATA1) using primers specific for the β-globin locus. G1E-ER4 cells are definitive erythroid cells expressing adult (Hbb-b1) but not embryonic (Ey, bh1) globin genes. (B) ChIP-qPCR as in A using primers specific for the Kit locus. The data shown are the average of 3–6 experiments. Asterisks indicate p < 0.05. ns, not significant. Error bars represent standard deviation.

