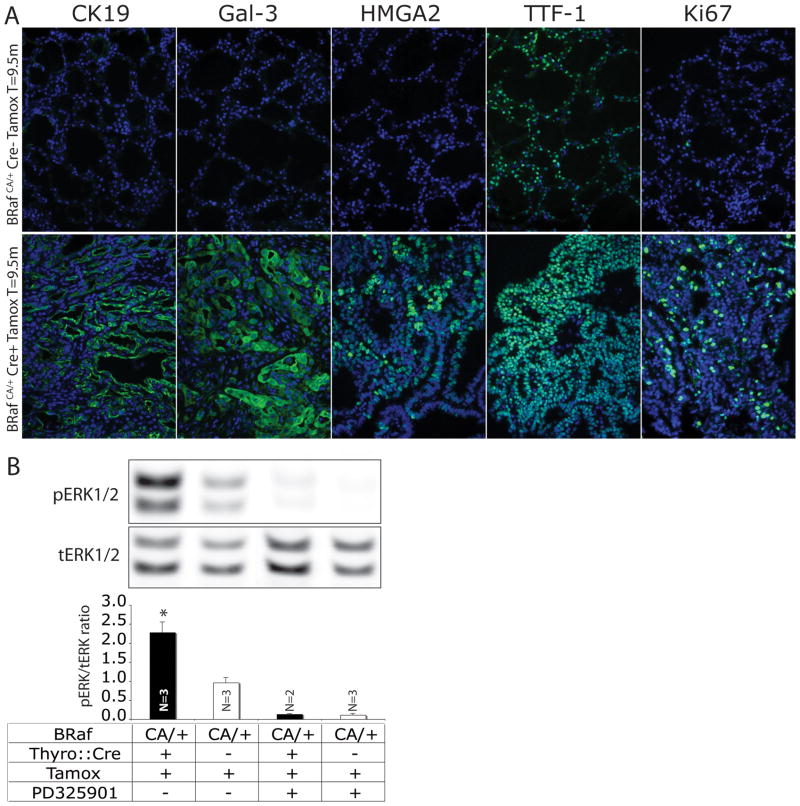
Figure 3. Biochemical characterization of BRAFV600E-induced thyroid phenotype.
A: Immunofluorescence analysis of histological sections of thyroid from control BRafCA/+ (upper panels) and Thyro::CreERT2; BRafCA/+ (lower panels) 12 months after tamoxifen administration. DAPI in blue and CK19, Galectin-3, HGMA2, TTF-1 and Ki67 in green as indicated. Magnification is 200x.
B: Representative immunoblots of phosho- (p) and total (t)-ERK1/2 in extracts of thyroids from control or PD325901 treated BRafCA/+ or Thyro::CreERT2; BRafCA/+ as indicated below. Specimens were isolated from mice 2 weeks after tamoxifen administration. Immunoblots were imaged and quantified using a Li-Cor Odyssey imaging system. The comparison of tamoxifen treated Thyro::CreERT2; BRafCA/+ mice (lane 1) to control (lane 2) has P ≤ 0.05. N=number of samples in each group.

