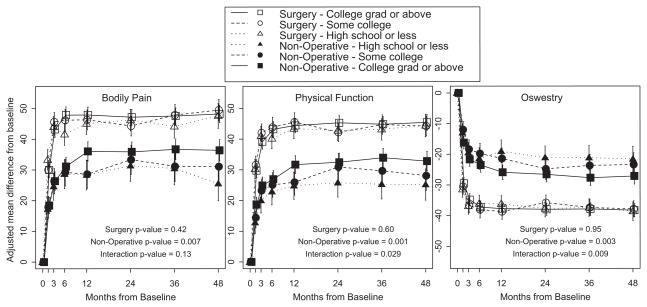
Figure 1.
Primary outcomes over time for ‘High school or less’, ‘Some college’ and ‘College grad or above’.
- The surgery p-value compares ‘High school or less,’ ‘Some college’ and ‘College grad or above’ among Surgery patients.
- The non-operative p-value compares ‘High school or less,’ ‘Some college’ and ‘College grad or above’ among Non-operative patients.
- The interaction p-value compares treatment effect (surgery vs. non-operative) among ‘High school or less,’ ‘Some college’ and ‘College grad or above’
* P-values are time-weighted averages at 4 years (area under the curve p-values)

