
Figure 2.
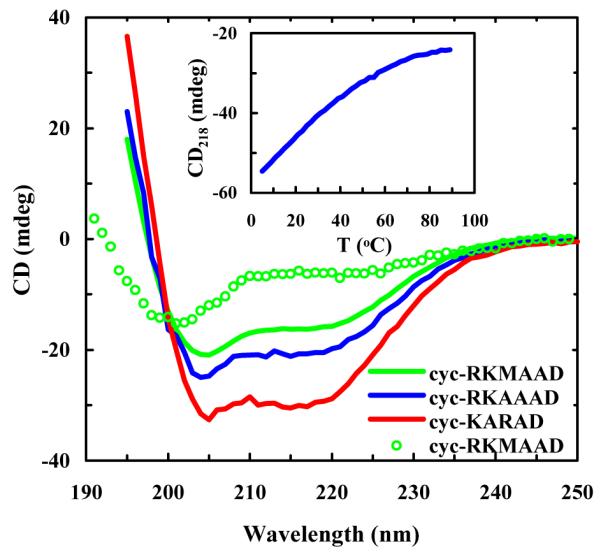
CD spectra of the cyclic peptides in 10 mM phosphate buffer (pH* 7) at 2.0 °C, as indicated. The difference in the amplitudes was due to the concentration difference. Also shown are the CD thermal melting curve of cyc-KARAD measured at 218 nm (inset) and the CD spectrum of cyc-RKMAAD obtained at 70 °C (open cycles).