
Figure 5.
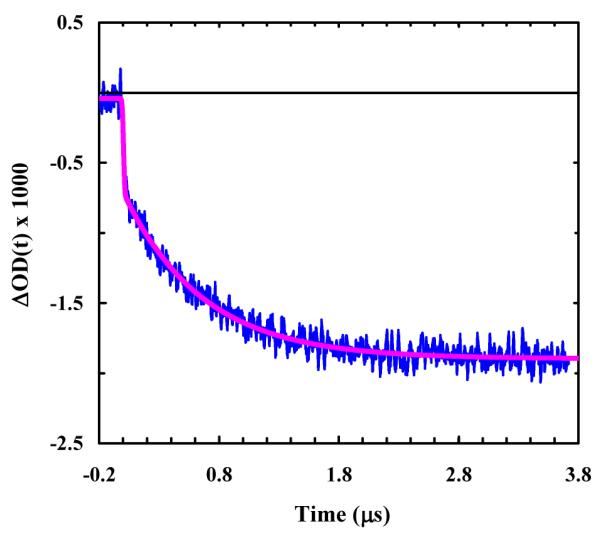
A representative relaxation kinetic trace of cyc-RKAAAD in response to a T-jump of 3.7 °C, from 14.2 to 17.9 °C. The blue line is a convolution of the instrument response function with the following exponential function: ΔOD(t) = A · [1− B · exp(−t /τ)], with A = −1.9, B = 0.64 and τ = 0.71 μs.