
Figure 6.
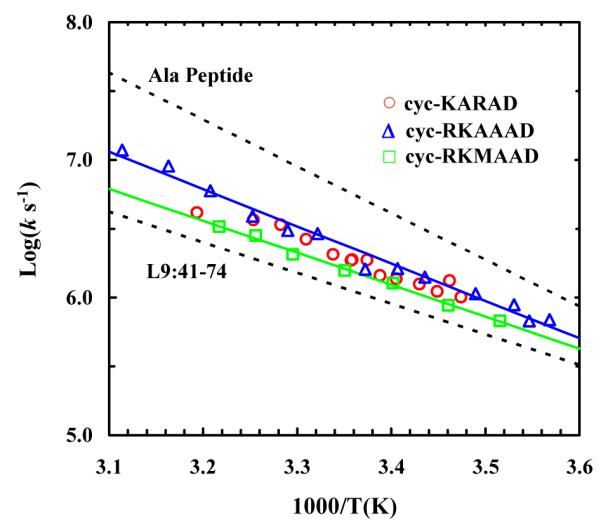
Arrhenius plot of the T-jump induced conformational relaxation rates of the cyclic peptides studied, as indicated. The corresponding smooth lines are the respective linear regressions of these data. Also shown for comparison are the relaxation rates of an alanine-based peptide6 and a naturally occurring helical peptide L9:41-74,44 as indicated.