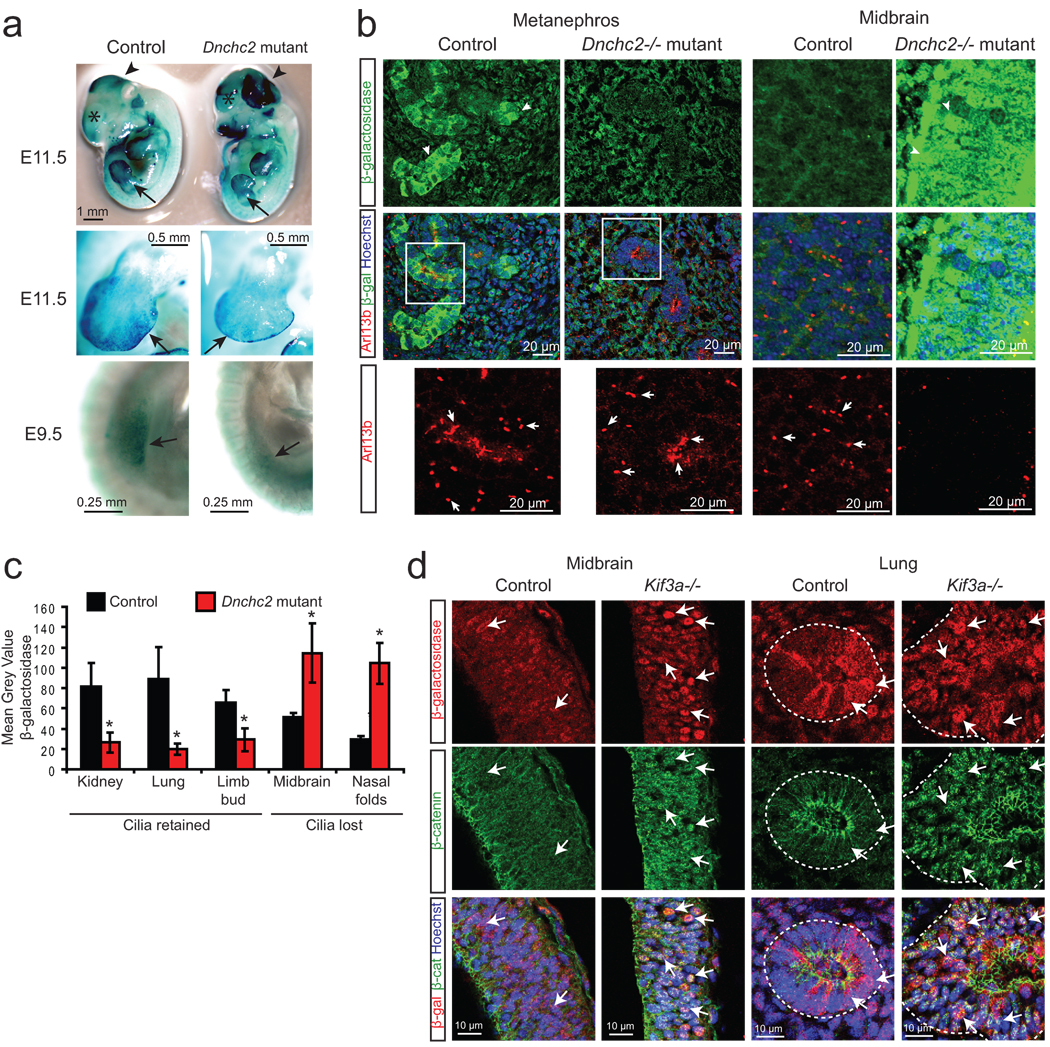
Figure 4. Wnt is regulated by the primary cilium during embryonic development.
a. X-gal staining (blue) of Dnchc2 mutants at E11.5 and E9.5. Arrows point to developing limb bud, arrowheads demarcate the mid-hindbrain region, and asterisks label the developing telencephalon. b. Representative E11.5 embryonic sections of the developing kidney (metanephros) and midbrain stained for cilia (Arl13b, red) and Wnt activity (β-galactosidase, green). Hoechst labels nuclei (blue). Arrows point to cilia in control and mutant tissue, which are shown as magnified insets for the metanephros. Images for control and mutant tissues were acquired and analyzed identically. c. Quantification of average staining intensity for β-galactosidase in representative tissues from three E11.5 littermate control and Dnchc2 mutant embryos. Tissues that are ciliated (kidney, lung, limb bud) and nonciliated (midbrain, nasal folds) in the mutant are shown for comparison of the effect of loss of cilia compared with specific retrograde IFT defect. *P<0.05, Student’s t-test. Error bars represent S.E.M. d. β-galactosidase staining (red) and β-catenin staining (green) in E9.5 midbrain and lung from Kif3a mutant and littermate control embryos. Arrows point to β-galactosidase reporter activity and β-catenin nuclear staining, both of which are increased in Kif3a mutant tissues.

