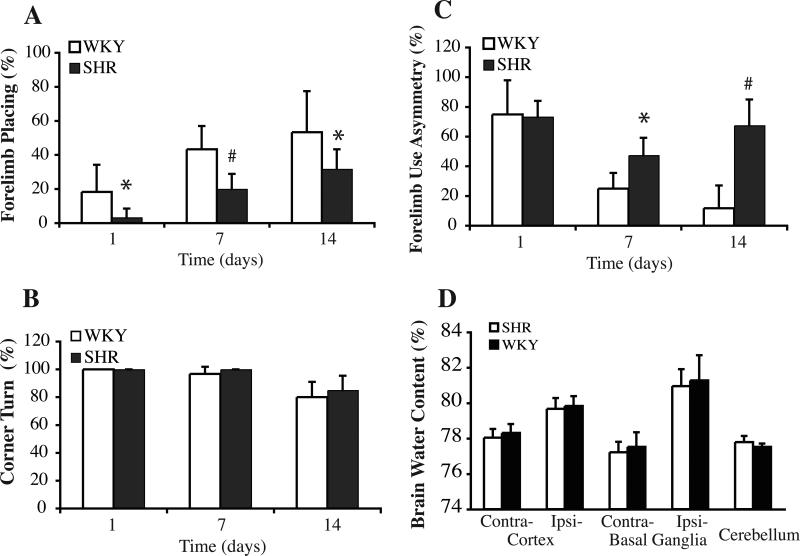
Figure 4.
Bar graphs showing the results of the forelimb placing (A, normal=100%), corner turn (B, normal=50%), and forelimb use asymmetry (C, normal=0%) tests in SHR and WKY rats after ICH. Values are mean±SD. *p<0.05, #p<0.01 vs. WKY. (D) Brain water content one day after ICH in SHR and WKY rats. Values are expressed as mean±SD. There were no differences in water content in the ipsilateral basal ganglia and cortex between the two strains.

