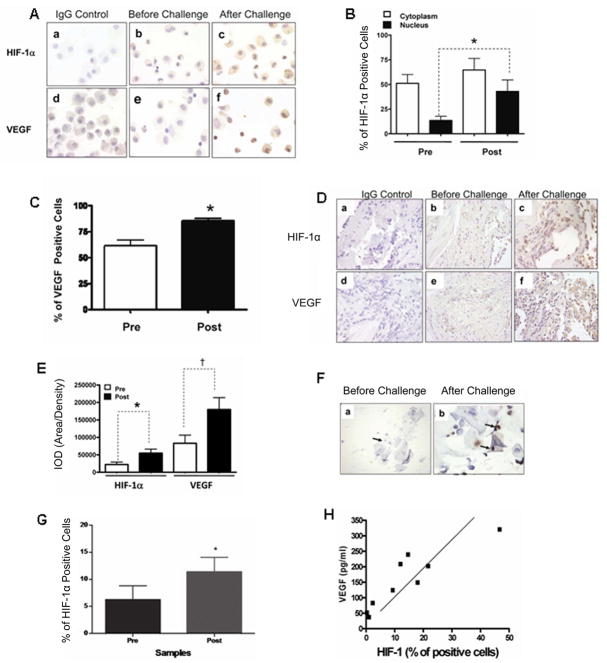
Figure 6. Enhanced HIF-1α and VEGF expression in bronchial lavage and lung tissue from asthmatic patients (A to E) and nasal lavage from rhinitis patients (F to H) after allergen challenge.
A. Representative photomicrographs of HIF-1α and VEGF immunostaining (100X) in epithelial cells from bronchial lavage of asthma patients before and after naturalistic cat challenge. The specificity of the antibodies is shown in staining with the IgG control. B, C. Frequency of HIF-1α and VEGF positive cells in bronchial lavage from 11 asthma patients. D. Representative photomicrographs of HIF-1α and VEGF before and after challenge (40X) in endobronchial biopsies. E. Quantification of the expression of HIF-1α and VEGF, before and after the cat challenge in 11 patients (pre and post challenge data was collected from the same patient). *p < 0.05, † p<0.01 (ANOVA). F. Representative photomicrographs of HIF-1α immunostaining (100X) in rhinitis patients before (a) and after (b) challenge. G. Quantification of HIF-1α positive cells (left), before and after the challenge. The mean and standard deviations were derived from data collected from 10 patients. H. Correlation analysis between HIF-1α immunostaining and VEGF expression as measured by ELISA (right), after the challenge. The analysis was performed from data collected from the 10 patients. Student t-test *p<0.05, † p<0.01 pre vs. post challenge HIF-1α expression. Pearson’s analysis *p<0.05, *r=0.7930 Post challenge HIF-1α vs.VEGF.

