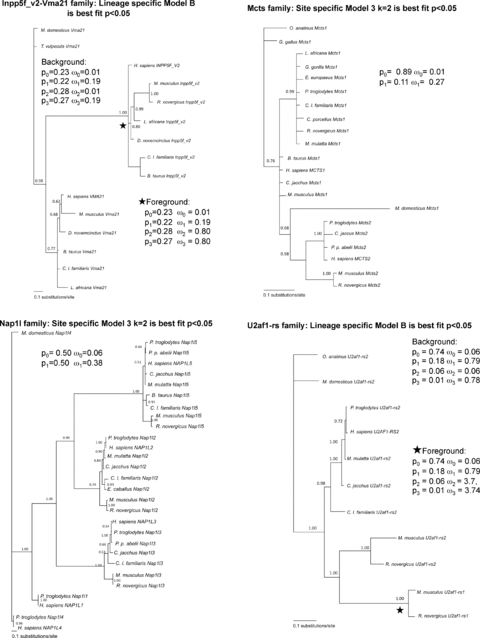
Figure 3.

Phylogenetic reconstruction for each gene family. Posterior probabilities for each branch are shown. ω values for the best-fit site-specific model (Mcts and Nap1l families) and foreground and background for best-fit lineage-specific model (Inpp5f_v2-Vma21 and U2af1-rs families) are shown.
