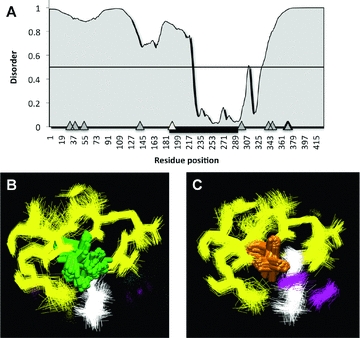
Figure 4.

Three-dimensional structure of U2af1-rs proteins. (A) Disorder prediction. Positions of all the positively selected residues along the protein are shown as gray triangles. Position of U2af35-homologous domain shown as thick black line. Positively selected residue within this domain shown as white triangle. Thin black line denotes disorder probability 0.5. Values above this predict disorder. (B and C) Closeup view of the neighboring residues to the positively selected residue. (D) U2AF1-RS2 isoelucine. (E) U2AF1-RS1 valine. Residues within 6 Angstrom cut-off from the isoleucine residue or valine residues are colored by secondary structure: beta-sheets yellow, alpha helix purple, and coil white.
