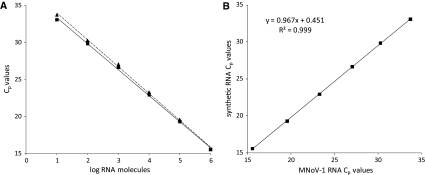
Fig. 3.
Comparison of the performance of the RT-qPCR assays using native and synthetic RNA. a Standard curve generated by tenfold dilutions (from 106 to 101 RNA molecules) of rFVB1 (triangle) and native RNA from MNV-1 extracted from infected cells (square). b Representation of the equivalence of the C p values of tenfold dilutions (from 106 to 101 RNA molecules) of rFVB1 (y-axis) and MNV-1 (x-axis)

