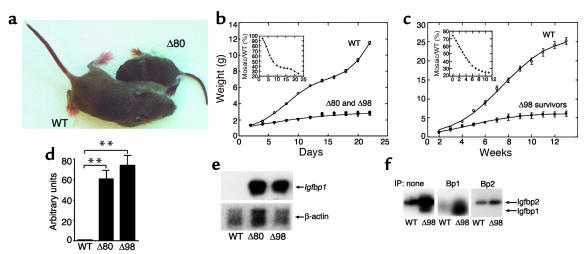
Figure 3.
Growth retardation in Insr mosaics. (a) Appearance of 3-week-old mice. (b) Average growth curves of WT and mosaic mice. The curves of the two subsets of mosaics are superimposable. The analysis was terminated at the time of death of Δ80 mosaics (n = 19 for WT, 18 for Δ80, and 15 for Δ98). (c) Δ98 survivors were followed for up to 13 weeks. The data represent the mean ± SEM (n = 28 for WT and 19 for Δ98 survivors). The insets present weight ratios of mosaic mice to WT control per time point examined. The decline of these ratios is indicative of lower than normal growth rate for the mosaics throughout the period of observation. (d) Real-time RT-PCR analysis of Igfbp1 expression in liver. We isolated total RNA from WT (n = 20), Δ80 (n = 17), and Δ98 (n = 20) mice and subjected it to RT-PCR using a Light Cycler instrument (Roche Perkin-Elmer). We normalized mRNA values using β-actin as a control. **P < 0.01. (e) Northern blot analysis of Igfbp1 expression. We pooled mRNA samples from four different mice for each set and analyzed them by hybridization with an Igfbp1 probe (upper panel), followed by a β-actin probe as gel loading control. (f) 125I-IGF2 ligand blotting. We obtained serum (5 μl for each animal) from WT (n = 10) and Δ98 mice (n = 10). In the panel on the left, we used whole serum to determine the presence of IGF-binding proteins. As shown, in the middle and right panels, we subjected serum to immunoprecipitation (IP) with the indicated antibodies (Bp1, Bp2) prior to gel electrophoresis and transfer to nylon membranes. We show the region of the gel in the 20- to 40-kDa region.

