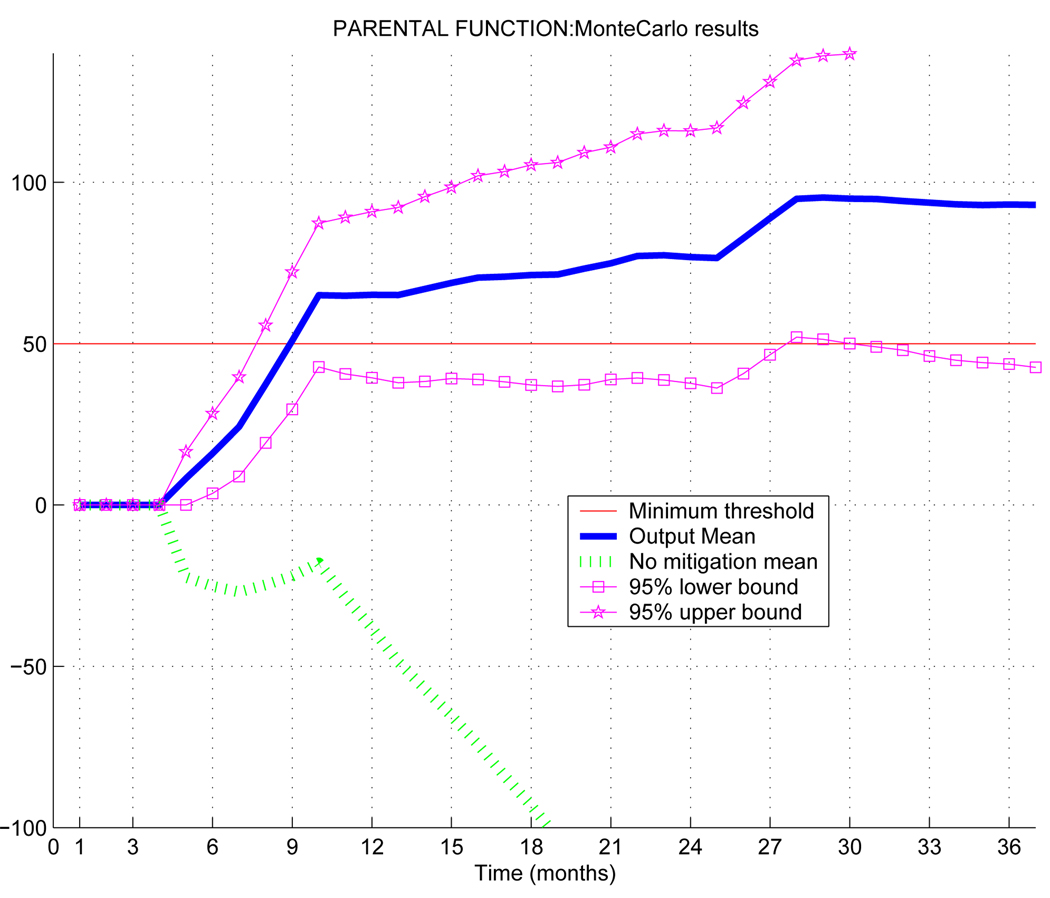
Fig. 7.
Monte Carlo simulation on the parental function. The solid blue line is the mean of the parental function in each month. The magenta lines with stars and squares represent the upper and lower bound, respectively, of the 95% values in the simulation, for the different scenarios. The dotted green line is the case of no mitigation.

