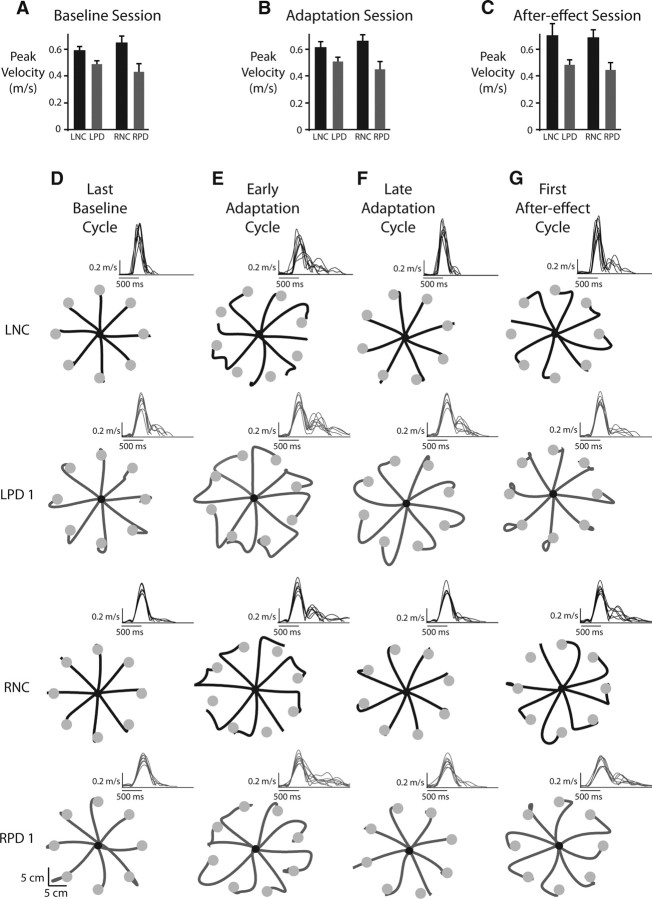
Figure 3.
Comparison of peak velocities and movement profiles. A, Mean ± SE peak velocities across all subjects in the left and right normal control (LNC, RNC, black bars) and left and right parietal damaged (LPD, RPD, gray bars) groups during the baseline session. B, Mean ± SE peak velocities across all subjects in the four groups during the adaptation session. C, Mean ± SE. peak velocities across all subjects in the four groups during the after-effect session. D, Hand paths for representative subjects in the LNC and RNC groups (black lines) and the LPD and RPD groups (gray lines) during the last eight trials (last cycle) of the baseline session. E, First cycle of the adaptation session. F, Last cycle of the adaptation session. G, First cycle of the after-effects session. Insets for the hand paths in D–G show the velocity profiles associated with those movements.

